How to quantify values in a graph from the image data?(Easiest!)
This article explains "how to quantify the graph in an image data".
(日本語のページはhttps://amazon-roba.hatenablog.com/entry/webplotdigitizerjp)
1. Which tool?
STEP.1 Just access WebPlotDigitizer - Extract data from plots, images, and maps.

STEP.2 Choose your language, and click "Launch Now!"(Green one).
(You don't need to download, just launch)
2. How to use "WebPlotDigitizer?
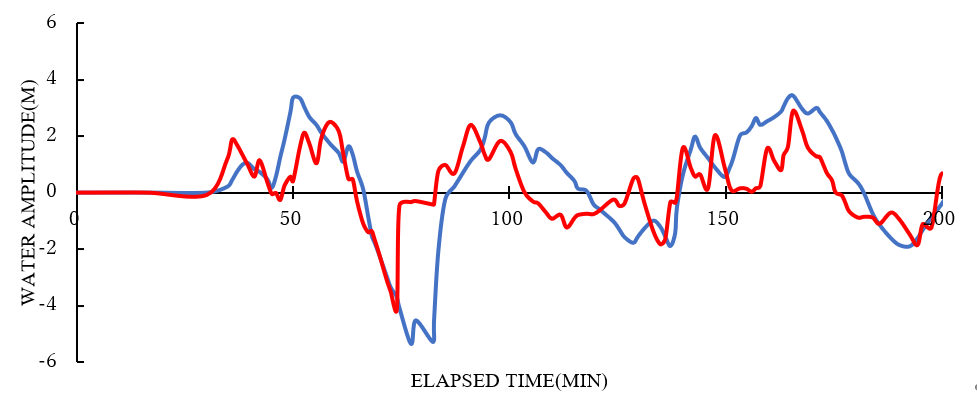
Example) I would like you to quantify "the water amplitude of red-soild line".

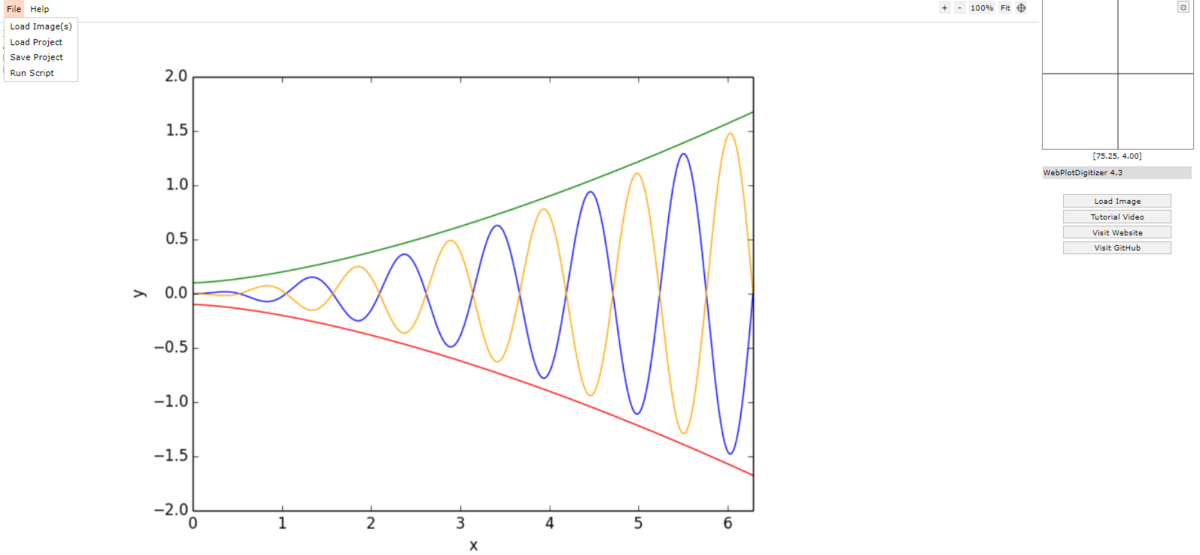
STEP.1 Click the "File", and open "Load image(s)"(Top-left side). we can upload the image and define the scale of the graph.

STEP.2 Determine the points of lower and upper values(X and Y axises), and input these lower and upper values of X and Y axises. Click "OK", then finally the information of the graph were inputed completely.
(You can also use for a graph with log-scales.)

STEP.3 Find "automatic extraction", and click the box filled some color.

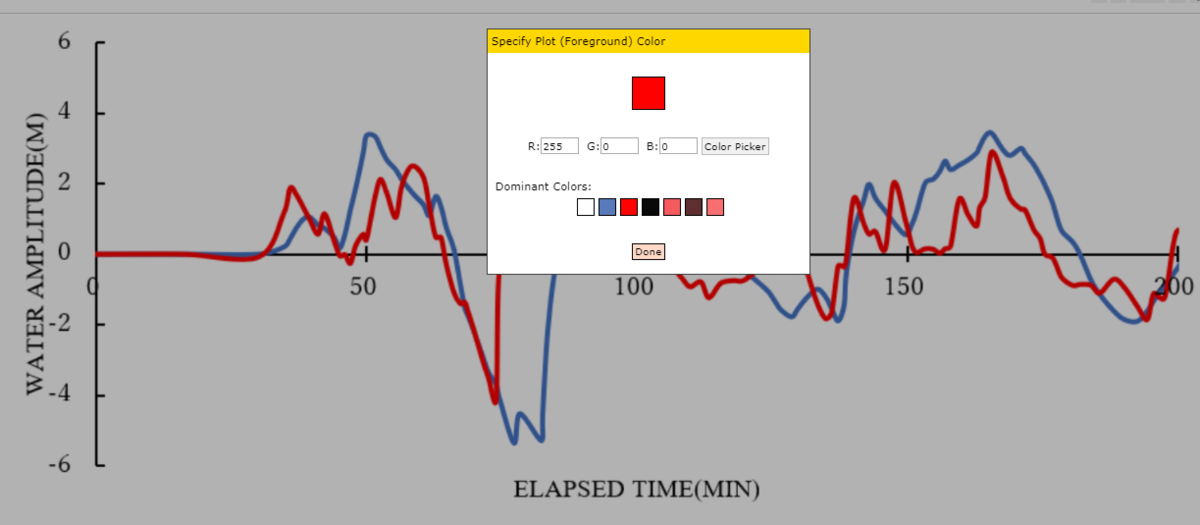
STEP.4 Open "Color Picker" and click the red-solid line. Then, click "Done".

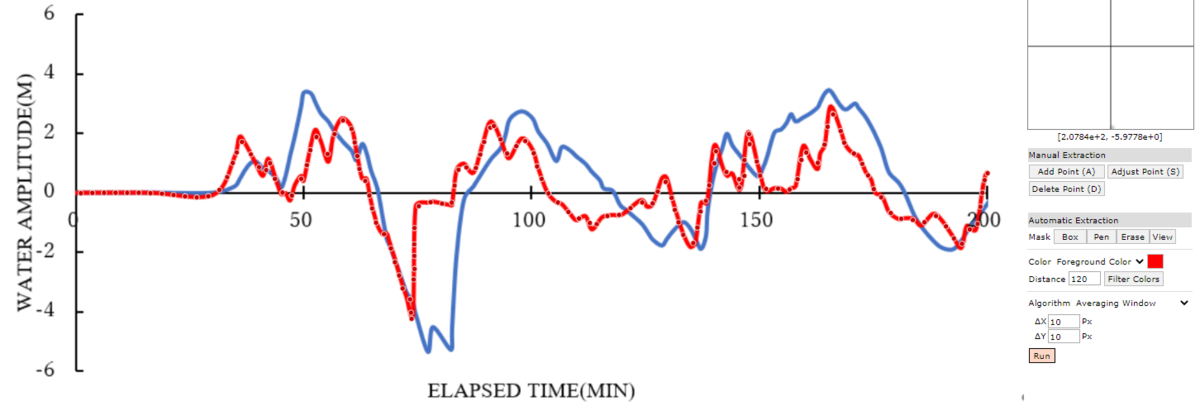
STEP.5 Find "Run" on the right side, and click it. Then, you can see some plots on the red-solid line.

LAST On the lift side, you can find and open the box"View Data".

Finally, you get all plot data(you can download as CSV file!)

I hope that it would help your work!!! See ya!! Prrrffff